After my first instant analytics post based on data from The Lupullin Exchange – John wondered if there was an imbalance between our hop popularity rankings and annual acreage harvested. After some digging into USDA data, we found out that there is a very large imbalance between supply and demand for many hop varieties
Supply Data
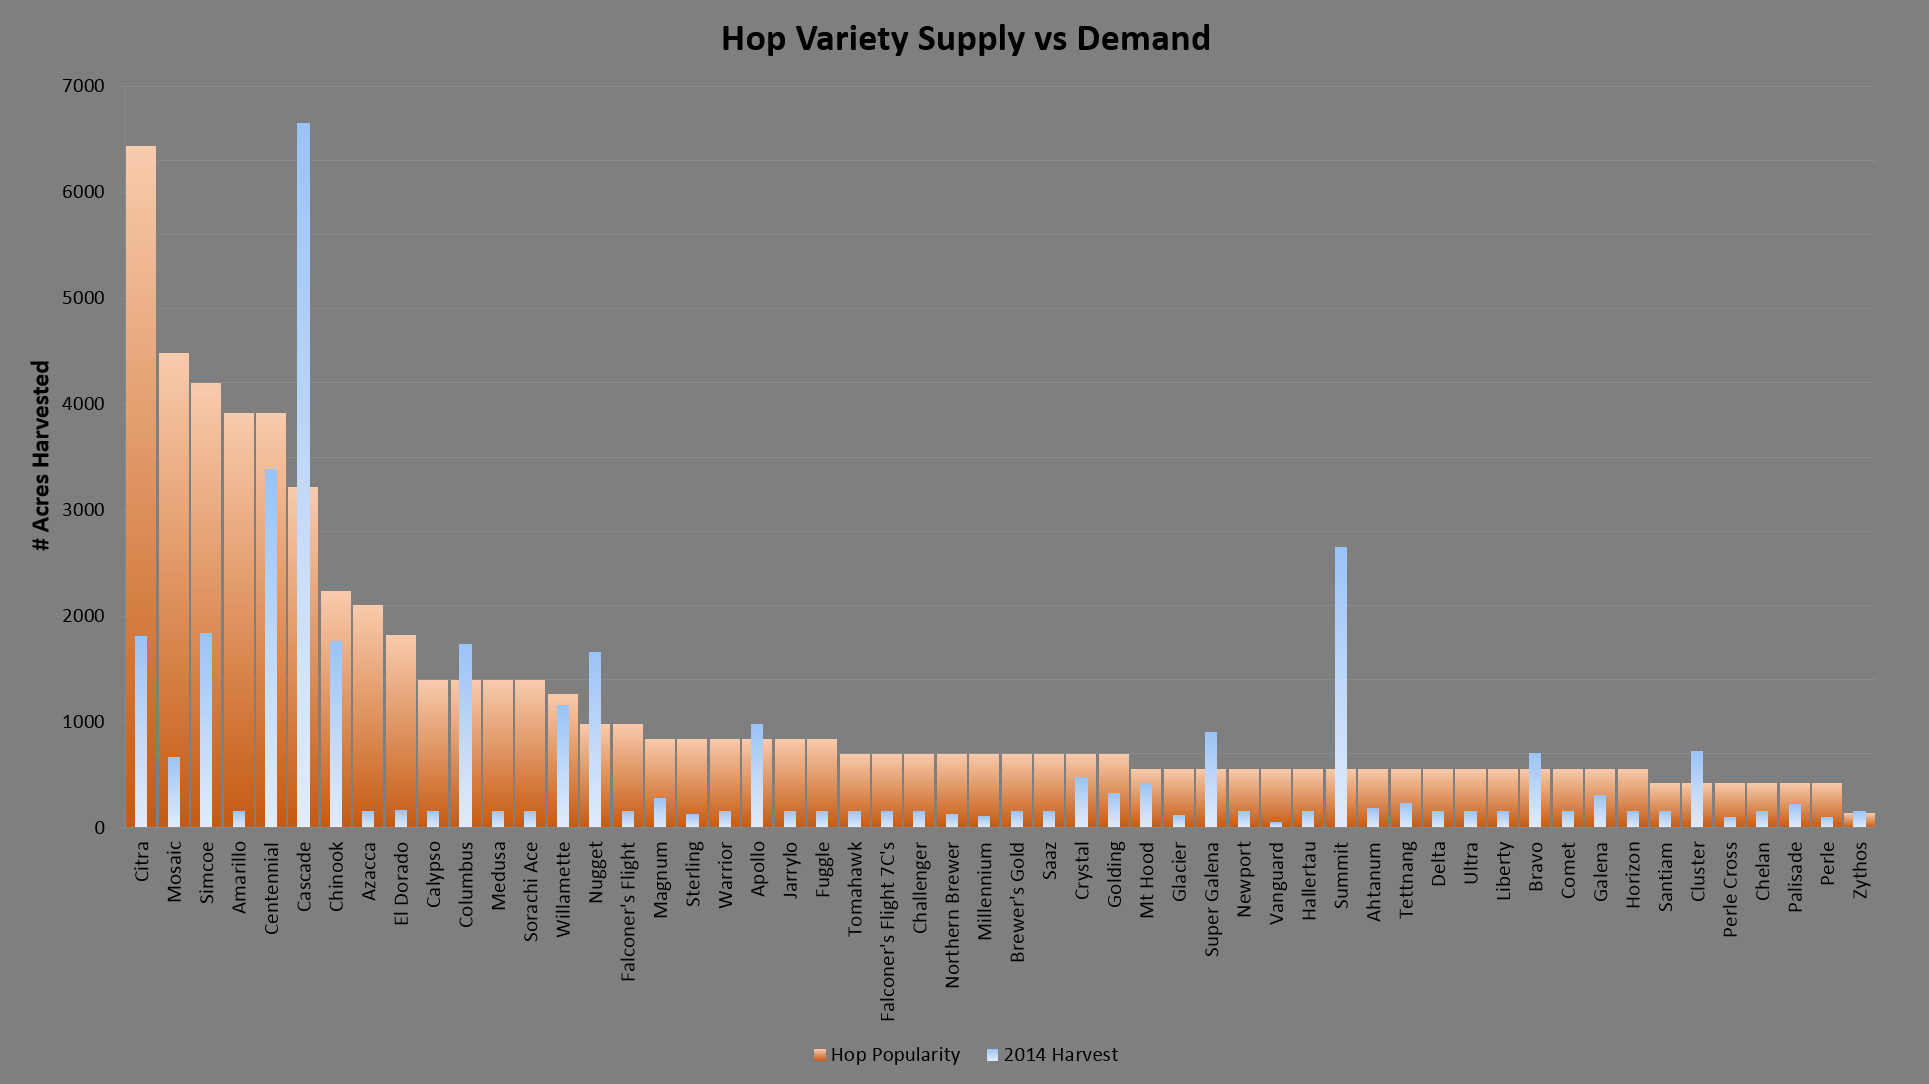
We have great data from the USDA on the number of acres harvested in 2014 by hop variety. This dataset required us to limit our charts to US hops only – but that is congruent with our demand data since we’re a US based exchange. Supply is represented in blue below (see “# of acres harvested” on the left). The #1 variety in the US in 2014 was Cascade with 6,651 acres harvested (> 17.3% of all hops) – the smallest variety was Vanguard with only 58 acres (< 0.2% of all hops).
Demand Data
I judged hop variety popularity by the number of hop alerts that Lupulin Exchange users have signed up for. If you are just joining us - The Lupullin Exchange has a really cool feature called Hop Alerts. Brewers can setup multiple Hop Alerts for the varieties of hops they are hoping to buy. When those varieties are listed for sale on the exchange, the brewer is instantly emailed with all the details - price, location/broker, alpha acid, packaging and a link to buy. It’s really useful and if you have not already done so, I highly recommend setting up alerts for your varieties of choice
About a week after the exchange launched, brewers had already signed up for about 430 hop alerts – four weeks later there are now more than 1,800 hop alerts (292% increase).
Popularity is indicated in orange in the graph below and the varieties are sorted by popularity along the X axis from left (most popular) to right
Availability of the Most Popular Varieties
Demand exceeds supply by no small margin for all 15 of the most popular varieties. Here is the general availability of the most popular hops (all percentages are amount of total hops harvested in 2014):
- ??? – Cascade (6,651 acres, 17.3%) and Centennial (3,389 acres, 8.8%) are a puzzle to us. While these two hops make up over 26% of all hops harvested - they still are in short supply. Perhaps Cascade is tough to find because it’s such a large component of Centennial Type
- Rare - Good luck finding Citra (1,815 acres, 4.7%), Mosaic (671 acres, 1.8%), Simcoe (1,838 acres, 4.8%), Amarillo (156 acres, 0.4%), Azacca (213 acres, 0.5%), or El Dorado (164 acres, 0.4%) at a decent price. Based on how fast these hops sell on our exchange – that’s something brewers already know.
Availability of the Least Popular Varieties
On the right half of the chart – supply and demand are relatively well balanced. Only Super Galena and Bravo tip over 500 acres (~1%) – but these hops are not in huge demand either. However, there are two big outliers on the bottom of our chart:
- Zeus is #2 with farmers (4,058 acres, 10.6%) – but doesn’t even crack the top 50 in popularity and didn’t make the cut off for our chart. We assume CTZ accounts for most of this discrepancy as CTZ checks in at #15 on our hop alert popularity scale
- Summit is fourth most plentiful variety (2,652 acres, 6.9%) – but isn’t in the top 40 in popularity.
I’m hoping to publish sales data from the exchange for the month of October in the next few days. It will be interesting to see if the price of Summit is affected.
I’m half way through two different blog posts – so I’ll be back in a few days with more instant analytics. In the meantime, we would love to hear about your observations or ideas for future posts. Please do not hesitate to contact us at support@lupulinexchange.com or comment below or via social media – we would love to hear from you!